How do low-energy buildings perform? The best way to find out is to test them once theyŌĆÖve been used. In the first of two articles, Thomas Lane reveals whether two new offices lived up to their promises
Nowadays buildings with natural ventilation, biomass boilers or ground source heat pumps are standard stuff. Understandably, most people assume that low-carbon build methods and tougher energy regulations mean buildings use far less energy than ones built a few years ago. But do these buildings use less energy? Does natural ventilation work when you are relying on people or complicated mechanical systems to open and close the windows? Are those anecdotal stories about biomass boilers continually breaking down true? Are ground source heat pump systems too complex for their own good? The reality is that only a handful of people know the answers, meaning most are designing low-energy buildings in a vacuum. Monitoring buildings for post-occupancy energy use is time-consuming and expensive. And if the money is found and the results arenŌĆÖt flattering, then the results are unlikely to get past the building owner out into the public domain.
Now ║┌Č┤╔ńŪ° can shed some light onto this difficult issue. We have teamed up with the Carbon Trust and BSRIA to bring you the true story of how well low-energy buildings really perform. The Carbon Trust administered the governmentŌĆÖs low carbon building programme, which funded a range of low-carbon technologies. It also advised on a range of energy efficiency measures. The buildings that benefited from this programme have been monitored for a minimum of a year after completion by consultants including Aecom and Arup. BSRIAŌĆÖs Rod Bunn, who was behind the PROBE series of post-occupancy evaluations in the nineties, has waded through boxes of raw data and number-crunched it into shape. In the first of two features we look at two new build, low-energy office buildings to see what Bunn found.
CANOLFAN RHEIDOL
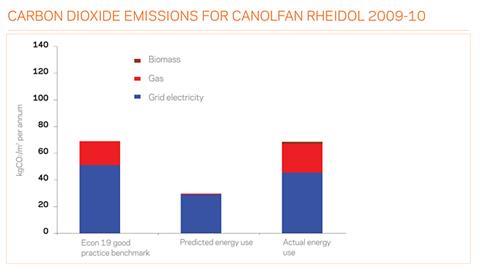
This office in Aberystwyth is typical of many recent good practice low-carbon buildings. It is mixed mode, meaning it is naturally ventilated with backup mechanical ventilation and cooling for very hot days or when the building gets stuffy in winter. Elsewhere it utilises energy-efficient lighting with solar thermal panels for hot water and there is a wind turbine too. The aspiration for this building was carbon emissions of less than 50kgCO2/m2 per year which was exceeded by a design calculation of 29.7kgCO2/m2 per year.
Actual carbon emissions were 68.5kgCO2/m2 per year. Although this is hardly a stellar performance, it is better than our other case study, West Suffolk House. Occupiers broadly like the building, rating it average to good.
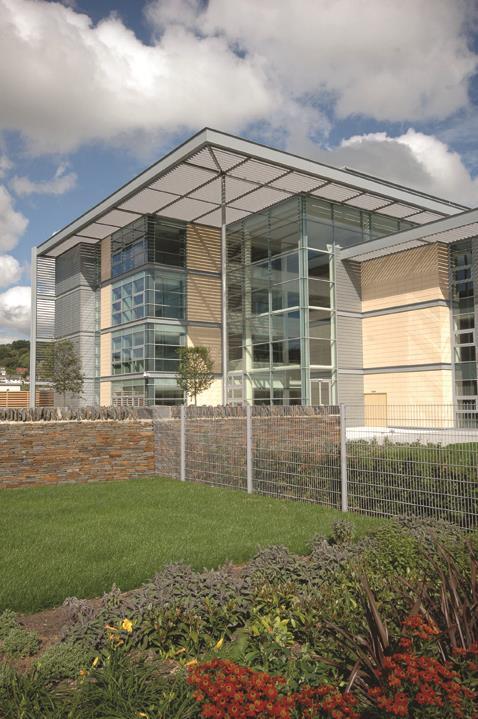
The building
The ┬Ż15m, 7,200m2 office is occupied by Ceredigion council and has a BREEAM ŌĆ£excellentŌĆØ rating. It consists of a three-storey and a four-storey wing sitting on either side of a central, full height atrium. Most of the building is open plan offices with some cellular accommodation on the ground floor.
║┌Č┤╔ńŪ° design and low-energy features
Canolfan Rheidol features a steel frame with precast concrete floors for thermal mass. It is naturally ventilated with air passing across the office floors and out through the top of the atrium. The building also has mechanical cooling throughout; this was needed for some areas that couldnŌĆÖt be naturally ventilated and for very hot days when backup cooling is desirable. High-efficiency ammonia chillers were specified to limit energy use.
High-performance glazing and external shading minimises heat gain and glare. Energy-efficient T5 lamps are employed with on-off photosensor control at the building perimeter and atrium side. Low-carbon technologies include the biomass district heating system, which is intended also to supply the Welsh Assembly offices next door. Eleven square metres of solar thermal panels supply 40% of the buildingŌĆÖs hot water needs and a 6kW wind turbine supplies an estimated 10MWh of electricity a year.
Energy use results
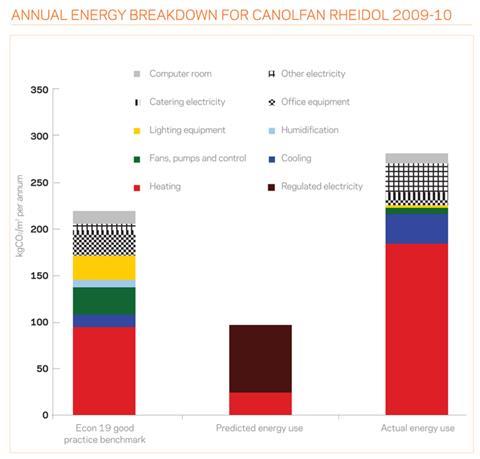
The buildingŌĆÖs regulated energy use (heating, cooling, lighting, pumps) is 219.26kWh/m2 per year, which is over double the prediction of 94.04kWh/m2 per year. Total energy use was 296.96 kWh/m2 per year. Separate figures for gas, electricity and biomass are not available.
The Energy Consumption Guide 19 (ECON19) is a set of standard and best practice benchmarks for different types of office building. It dates from the nineties when energy regulations were much less onerous. The building performs below the ECON19 benchmark of 166.68kWh/m2 per annum for regulated energy. Total energy use is also worse than the ECON19 benchmark of 213.08kWh/m2 per year. This is a poor result for a state of the art low-carbon building.
Carbon dioxide emissions
The high energy use is tempered by the zero carbon biomass heat source. The building emits a relatively respectable 68.5kgCO2/m2 per annum, which is about the same as the ECON19 benchmark for a best practice building. This means the building could just about be described as low-carbon although it doesnŌĆÖt meet its own carbon emission targets of 50kgCO2/m2 per annum. Furthermore, resorting to low-carbon energy sources is no excuse for high energy consumption.
What went wrong?
The high energy use is largely down to the heating system - this makes up 179.1kWh/m2 per year against the prediction of 23.4kWh/m2 per year. Inefficiencies include the biomass boiler operating at part load. Calculations show that there are large losses in the 280m long distribution pipe between the boiler and the building. This is 37% during the warm, low heating load season and 22% during the winter. Cooling energy use is also high compared with the ECON19 benchmark, although this could be accounted for by more ICT compared to the ninetiesŌĆÖ benchmark and the associated need for more cooling.
The natural ventilation strategy works well although energy performance could be improved by fine tuning. The wind turbine is a dead loss, providing just 1,258kWhr per year, an eighth of the original prediction. In fairness, the manufacturer warned that the installation could consume more energy than it produced.
What the users think
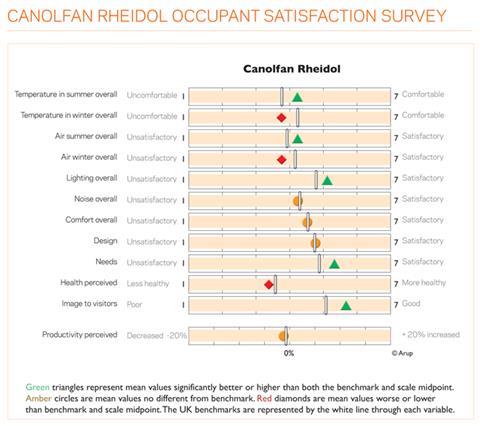
The building was benchmarked against a database of comparable office buildings. It gets a broad thumbs up with occupiers who are happy with summer temperatures and ventilation. They are also happy with the lighting although there have been complaints of too much light at the perimeter, which was rectified by fitting blinds. This means people further away from the windows feel they donŌĆÖt get enough natural light when the blinds are closed. There is dissatisfaction with the winter temperatures and air quality. Noise issues are average compared with the benchmark, with complaints typical of open plan offices - there is noise from other floors and people sitting near the atrium say the canteen is noisy. People also complain of sore throats, dry air and dry skin.
What this tells us
The data presented here was taken from the first 12 months of occupation so there is still some fine tuning to do, which will ultimately improve performance. This includes defining the point at which the mechanical ventilation system takes over from natural ventilation mode. In cold weather the building will use less energy in mechanical ventilation mode with heat recovery so windows must be closed. In hot weather the windows must also be closed when the mechanical cooling system kicks in. Users need educating not to open windows at the wrong times.
A big problem is the metering, which is ineffective here and hinders optimisation. Low-carbon buildings need comprehensive and clearly labelled meters as this is the only way building performance can be understood and optimised. Also, metering will reveal when things go wrong. For example, it is possible the ignition gas burner is being used to maintain temperatures from the biomass boiler when there is a problem with the biomass fuel supply. Also, according to the meters, the solar panels are producing a quarter of potential output - this could be down to a metering problem or something wrong with the solar array.
The other issue is the tools used to predict performance. There is such a big discrepancy between predicted and actual heat use that there must be question marks over the accuracy of these tools. ŌĆ£There is a lack of detail in the simulation modelling rather than buildings that are inefficient,ŌĆØ says Bunn. ŌĆ£It brings into question the accuracy and effectiveness of our simulation modelling,ŌĆØ he says. ŌĆ£We are trying to build on false expectations.ŌĆØ
The designerŌĆÖs reaction
According to Richard Dalley, Hoare LeaŌĆÖs team leader on Canolfan Rheidol, there is a good explanation for the buildingŌĆÖs high heating demand: the insulation on the pipes between the energy centre and building was damaged during installation. A railway line separates the energy centre from the building, which meant threading the heating pipes through sleeves that had been inserted under the line, damaging the insulation. The client was alerted to the problem when they saw steam coming out of the ground. Fixing the problem involves digging up part of the car park but should make a big difference to the buildingŌĆÖs heating demand.
Dalley says he understands the client wanted to be able manually to switch on the HVAC system when it was too hot in the summer or stuffy in the winter. This means the system may be left off when it would be more efficient to mechanically ventilate the building.
Fine tuning the automated window opening system has been a challenge, too. ŌĆ£The big lesson is controllability of the windows as these were springing open in the winter when it was very cold,ŌĆØ he says.
ŌĆ£The focus is on fine tuning the control so the windows only open a little bit.ŌĆØ
WEST SUFFOLK HOUSE
In some respects this building in Bury St Edmunds is very similar to Canolfan Rheidol. It is a naturally ventilated office building and is a similar size. There is one key difference, which is why we have featured it here: instead of using a biomass district heating solution it relies on ground source heat pumps for heating and cooling. The building fabric is better than baseline 2006 ║┌Č┤╔ńŪ° Regulations requirements and it boasts natural ventilation, sophisticated lighting systems, ground source heat pumps for cooling and heating and some solar panels. All this added up to a carbon emissions design prediction of 31.4kgCO2/m2 per year, which exceeded Part L.
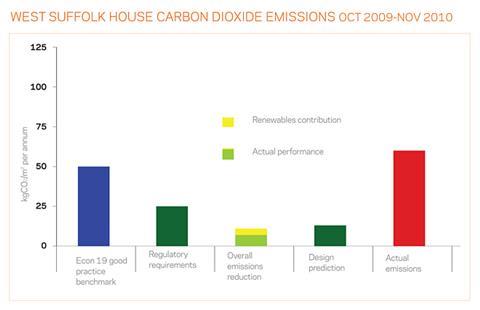
Unfortunately the reality is very different: the building emits 88.4kgCO2/m2, which is nearly three times the design estimate, meaning it could not fairly be described as a low-carbon building. To add insult to injury the building is slated by its occupiers who complain the building is either too hot or too cold, makes them ill and is noisy.
The building
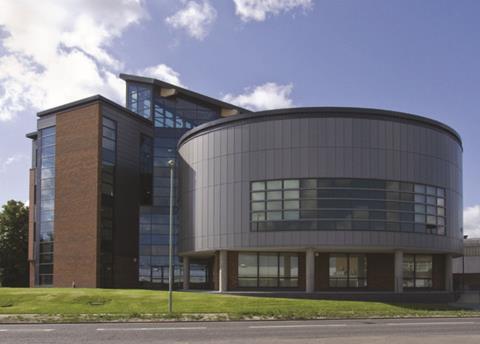
West Suffolk House is a four-storey, 6,430m2 office costing ┬Ż20.6m. Shared by St Edmunds council and Suffolk council, the open plan office space is arranged around a central lightwell that helps get light into the deep floor plates. A large public cafe is located on the ground floor under this lightwell. Upper floors contain meeting rooms, a conference hall and a room for the mayor. Breakout spaces and staff kitchens are located next to the lightwell on the upper floors.
║┌Č┤╔ńŪ° design and low energy features
The concrete-framed building is naturally ventilated with windows controlled by mechanical actuators. Occupants can override this and open the windows. At night, cool air is admitted to the building, cools the concrete structure and passes out through high-level windows at the top of the lightwell.
The wall U-value is 0.28W/m2K, which beats ║┌Č┤╔ńŪ° Regulations and the windows feature solar control glass with a U-value of 1.51W/m2K. The Low Carbon ║┌Č┤╔ńŪ°s Programme funded a four-pipe open loop ground source heat pump, which provides simultaneous heating and cooling. The
co-efficient of performance is 4, so the system produces four units of energy for every unit put in. Warm water is circulated through pipes embedded in the slab during winter and cool water in the summer when it is too hot for the natural ventilation strategy to cope. Mechanical cooling is used for ground floor and other meeting rooms. The building also features roof mounted solar thermal collectors that provide 20% of the annual hot water needs. The best practice lighting system features daylight dimming T5 lamps and passive infrared detection.
Energy use results
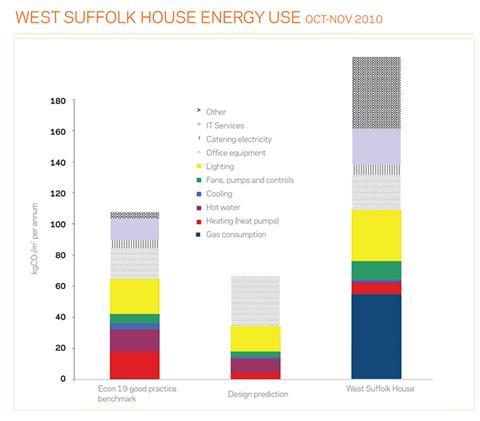
Despite all these bells and whistles, data from the first year of occupation shows the building is a gas guzzler. Regulated energy use, which covers heating, hot water, cooling, lighting and pumps is 102.4kWh/m2 per annum, three times the design prediction of 34.4kWh/m2 per annum. Total energy use is 201kWh/m2 per annum, again three times the design estimate of 66.2kWh/m2 per annum. Gas use was high at 48.3kWh/m2 per annum against the prediction of 13.9kWh/m2. Given that solar array generates more heat than is needed in summer, much of the gas consumption must be for heating.
How does this compare against industry standard benchmarks? The ECON19 best practice benchmark has been modified to reflect the mixed cooling strategy employed at West Suffolk House. The ECON19 benchmark is 103kWh/m2, half that of West Suffolk House. The building received an EPC rating of A but this high energy use means the display energy certificate is an E, although this includes energy use for everything. Energy use should improve once teething problems are sorted out.
Carbon dioxide emissions
Inevitably the high energy use translates into high carbon emissions so this project cannot be described as a low-energy building. It emits 88.4kgCO2/m2 per year, nearly three times more than the design estimate of 31.4kgCO2/m2.
What went wrong?
There have been a multitude of problems with this project. The very tight building programme meant design was being carried out at the same time as construction. A value engineering exercise was needed during construction to rein in burgeoning costs.
There were teething problems when the council moved in. For example, an incorrectly located temperature sensor on the ground floor meant the open plan areas were too hot during the first winter. Excessively high gas consumption indicates that gas backup boilers have been churning out heat and it is possible most of this has gone out of the windows or the cooling system has been on at the same time as the heating. Arup says it suspects the cooling system has been operating all year. The lack of a proper commissioning plan for the building could explain why these systems arenŌĆÖt working in harmony and why the ground source heat pumps arenŌĆÖt working optimally with the natural ventilation and solar thermal panels.
There have been problems with the lights defaulting to on, even when people have left the building. The lights have stayed on in the day even though the automated dimming system should switch these off when it is bright outside. Out-of-hours energy use is double the base load, which means equipment other than ICT is using energy.
Identifying exactly where the energy is going has been difficult due to inadequate metering. For example, these record lighting and small power, making it difficult to apportion use.
Also the energy meters to the heat pumps did not work for the first three months. Furthermore it is hard to tell the contribution being made by gas boilers, the heat pumps and solar thermal panels to heating.
What the users think
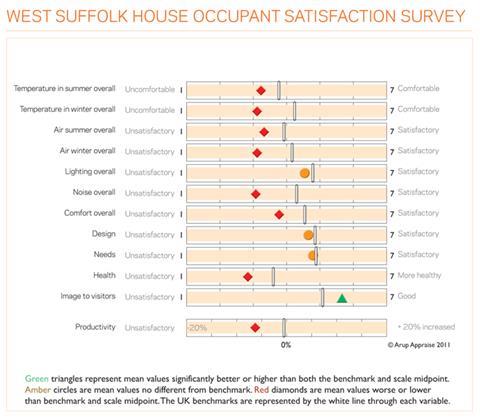
The survey was carried out after two years of occupation with 241 staff responding. People were unhappy with temperatures, complaining it was either far too hot or too cold. The 11m floorplates are very deep, which is stretching the natural ventilation strategy to the limit. Locating the cafe at the base of the lightwell appears to be a mistake because excessive noise was another common complaint. People also grumbled about feeling tired, suffering from headaches and a greater incidence of colds and flu. Glare was another issue because the planned brises soleil were value engineered out of the project. Nevertheless, people felt the building projected a positive image to visitors.
What this tells us
This building demonstrates that a complex low energy strategy must have an effective control system to be effective. Because there wasnŌĆÖt an effective commissioning plan to set this up, this building hasnŌĆÖt performed as predicted - for example, running the heating and cooling systems at the same time is extremely wasteful. The other problem is a lack of separate metering for the gas, heat pump and solar panels, which means it is hard to tell which source is providing how much heat; this means the building manager does not know if the building isnŌĆÖt performing optimally.
The other issue is design. The deep floorplates of this building are pushing at the limits of what can be achieved using natural ventilation strategy. Also locating a big cafe at the base of a lightwell flanked by open plan offices above is bound to cause noise issues.
BSRIAŌĆÖs Bunn is not surprised by these results. ŌĆ£What we knew 10 years ago from the PROBE projects is that unmanageable complexity is the enemy of good performance,ŌĆØ he says. ŌĆ£What we are doing is introducing complexity into buildings without thinking about procurement, commissioning and training people how to use these systems. This includes fine tuning after commissioning and following through with technical support. That is
what matters.ŌĆØ
The designerŌĆÖs reaction
A statement from Pick Everard, the architect and engineering firm on West Suffolk House, said:
ŌĆ£It is clear that as an industry we need to continue improving the monitoring and analysis of the energy performance in buildings. We are pleased that West Suffolk House has benefited from a period of post occupation monitoring as this is an important part of continual improvement within the industry. It is difficult for us to comment without being able to review the data. However, the monitoring period is the initial year of occupation during which the BMS system was being adjusted, teething problems resolved and a number of individual components failed and were replaced - including the ground-source heat pump system; these factors would have affected the survey data, results and conclusions.
ŌĆ£We understand through our ongoing dialogue with the client that the energy performance has improved and the occupiers enjoy the benefits of this building. We are actively engaged in improving the performance of buildings in operation and welcome recent initiatives that will consolidate the need for extended post occupation evaluations beyond the first year of use of buildings to become an integral part of the whole life construction process.ŌĆØ
This feature is based on the reports prepared by Rod Bunn for ║┌Č┤╔ńŪ° on behalf of the Carbon Trust. These reports contain more detail on the buildings including procurement, design and building services.
Downloads
Full report on Canolfan Rheidol
Word, Size 0 kbFull report on West Suffolk House
Word, Size 0 kb


1 Readers' comment