The first of our quarterly articles on whole-life costs focuses on primary schools. David Weight of Currie & Brown outlines typical expenditure on a basic single-storey building, then analyses the additional capital, energy and repair and maintenance costs of a further two building types
Introduction
This is the first of a series of articles on cost modelling and morphology. The work by the author started back in the mid 1980s when modelling was developed to integrate capital, energy and maintenance and replacement costs1. Since then, it has developed into Currie & Brown’s Live Options software, which is an integrated suite of geometric, engineering and energy calculation programs.
Whether the development is an office, school, hospital or warehouse, the process starts in the same way, by using a basic but faculty-specific design template. This template is modified to incorporate, for example, changes in the size, shape, and operational performance.
The model had been used for a number of years for large variety of buildings. These have included those with a mixture of courtyards and atriums at different levels; some that are built into sloping ground; buildings that are different in shape and size and storey module at each level and buildings of a wide mixture of complex shapes.
The program integrates fabric and building services components for the purposes of value-engineering. For instance, by increasing the proportion of glazing in the facade, the model will instantly provide a detailed breakdown of what has changed in the design and therefore the cost of the building. This breakdown will include will not only provide details of the capital cost of the physical items, but will also have taken account of its effect on the building in relation to heating and cooling loads and will have made quantified changes to all dependent elements such as chillers and electrical supply loads.
In addition to the capital cost, a change to the energy profile of the facility is calculated; this data is subsequently transferred into the whole-life cost module of Live Options to assist in the assessment of the cost effectiveness and overall viability of alternative solutions when considered against the facility’s projected economic life.
Each component, other than items such as excavation, piling or fees, is associated in Live Options with a series of “cost liability” intervals and rates, in up to four categories:
- Planned maintenance;
- Replacement (partial or total);
- Regular inspection, servicing or cleaning;
- Unplanned repairs or maintenance.
A component’s future liability data is automatically cash-flowed, discounted and summarised. Net present costs are shown against each component, which assists in making choices and in value-engineering. Planned maintenance events are automatically deducted pro-rata in any year in which part or full replacement occurs instead.
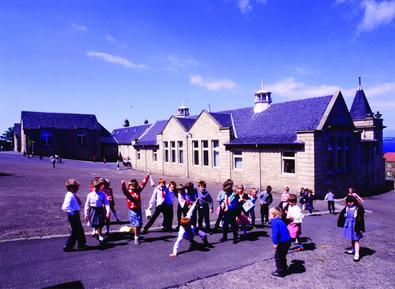
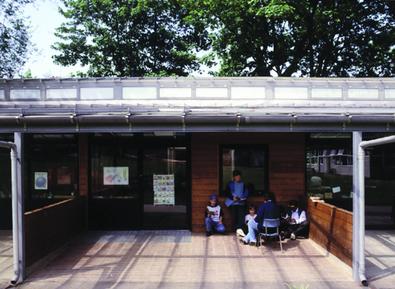
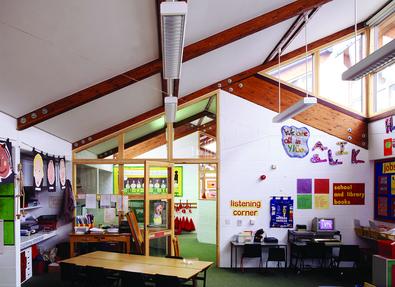
In this article, we consider whole-life costs of primary schools in response to recent advancements in school design. Expectations for primary schools have risen in recent years, and the DfES exemplar schools programme has reinforced this. Budgets and allowances have increased accordingly.
Shown right are the typical capital, energy and repair and maintenance costs for a basic single-storey primary school. Overleaf are the increases or decreases in those costs of the same school with increased ceiling heights and glazing, and on pages 82-83, the figures for a two-storey school with a smaller footprint.
Scenario 1: An increase in ceiling height and glazing – capital costs
This considers a 1.4-storey primary school, in which classrooms are naturally ventilated and daylit on one side only. Daylighting standards too have tended to improve, not only in the level of provision of daylight but in its evenness and distribution. The graph below shows an estimation of the economic effects of increasing the clear height to provide more opening lights at high level, both to assist ventilation and to promote daylight penetration.
Just two model inputs have been changed: the clear height from 2.4 m to 2.7 m, and an increase in the proportion of glazing.
Not surprisingly, most of the cost effects are the vertical elements. The logic would be that these would comprise the same materials from one building type to another, but the weightings and costs would change.
Taking the main elements in order as they appear on the graph:
- Substructure: Just a small change to column foundations (green) in response to a slight increase in the weight.
- Structure: Increase in columns of frame (red) for extra height.
- Envelope: Not all the extra facade is window (yellow) so some extra wall is generated (blue). Red denotes the extra cost of downpipes since these have got longer. (The “envelope” group element includes all components that can be seen from the outside).
- Internal division: Both load-bearing (red) and non load-bearing (green) are increased, but doors are not, since these are based on the number of rooms.
- Finishes and fittings: The main extra cost is the bases and finishes to walls (red). Pink denotes the extra costs of blinds to windows.
- Mechanical: Red denotes the increased length of rainwater and foul downpipes. Blue is the extra cost of the boiler installation, based on kW heating load. Each enveloping component is associated with a U-value, and so as the envelope is changed, the model recalculates the demand under design load conditions, which is used for costing the heat source. Cost estimating ratios (CERs) deal with the relationship of price to capacity. Available sizes are not usually known at this stage, but modelled sizes may be overridden if available sizes are known.
- Preliminaries, profits and overheads are based on simple but consistent percentage allowances, although more refined methods may be used instead.
The extra capital cost of a 300 mm increase in clear height (adding 5% for design and price risk and 5% for construction contingency) is approximately £140,000.
Scenario 1: An increase in ceiling height and glazing – energy costs
Changes in energy costs are illustrated in the table right. Prices for fuels are taken as 7.2p/kWh for electricity and 3p/kWh for gas, which is used for heating.
- The building’s fabric losses have increased, because windows have an inferior U-value to external walls.
- The main part of ventilation losses, being air supply for people, is unaffected, since occupancy is unchanged.
- The additional energy costs for the mechanical ventilation result from the power needed for the fans following the increase in a building’s volume, assuming the same air change rate per hour.
- Solar gains have helped to compensate for the increased fabric losses. For this exercise, it is based on a neutral orientation and no winter shading.
- Infiltration losses have increased, too, because of the increase in vertical envelope area.
- The usage of lighting is assumed to reduce in response to improved daylight availability. This is based on the assumption that lighting controls have solar detection, or that staff and caretakers are vigilant in switching off lights when daylight is adequate.
- The overall effect on energy consumption is an extra £195 a year. Over 30 years, using a real discount rate of 3.5%, the net present cost (NPC) is £3510, say £3500.
The NPC is the capital cost equivalent of future amounts, and is the amount of money that, if invested as a sinking fund, would be enough to pay for all the energy over 30 years, based on the assumption that the money would be invested at a rate that is on average, 3.5% greater than the rate at which energy cost inflation would erode the fund’s purchasing power.
Scenario 2: Adding another floor and reducing footprint – capital costs
With land increasingly in short supply, two-storey primary schools are becoming more common. Also, two-storey construction might enable the new building to be completed prior to demolition of the old school on sites where new-build and demolition would normally have to happen in phases, perhaps using temporary classrooms. Scenario 2 compares the whole-life costs of the two-storey school with the single-storey base building (details on page 78).
In the following example, the gross floor area has been increased for the two-storey school to include the additional area need for vertical circulation if the net (teaching) area is to be similar. In doing this, the model “suggests” the number of stair shafts according to maximum escape distances, and step widths according to BS5588. It also adds a lift, which will be required for access for disabled people.
For this scenario, changes were needed for just three inputs as follows:
- Switch from one to two storeys;
- Add extra gross internal floor area for the lift and three stairs;
- Very small increase in preliminaries to allow for slightly increased difficulty of access to work upstairs and for scaffolding.
Both options assume a steel frame. This is not always required except for the hall, but the use of a structural frame does allow more freedom in the placement of walls, both initially and in the future.
- Substructure: The dominant issue here is a saving on area and cost of the ground slab (light blue), ground preparation (red), and girth of foundation walls (blue). There will be almost a 50% reduction in the number of individual column foundations and associated ground beams (green), but they will be larger because of the extra weight on each column, so their costs have not changed much. The one small extra is the lift pit.
- Structure: Red indicates the increase in frame costs. Green denotes the extra area and cost of upper floors, and the yellow indicates the cost of the stair structure and associated balustrading. (Unlike the BCIS system, we group the last two together since they are often arrive on site as a prefabricated unit.)
- Envelope: The reduced roof area is the big saving (red) and the associated rooflights (green). Pink indicates the saving on the window cleaning cradle runway caused by the reduced girth of roof. Light blue denotes a small saving in the number of external doors. The vertical envelope has increased a bit, denoted by blue (walls) and yellow (windows).
- Internal divisions: Red indicates the load-bearing walls to stair shaft and lift shafts, and the light blue is the doors to the last. Hence the saving on non-load-bearing wall types shown in green.
- Finishes adjust according the areas of structure to which they apply.
- Mechanical: Green denotes the wet riser in stair shafts. Blue indicates the slight extra costs of heating as the kW design load capacity has increased. Pink denotes extra mechanical ventilation for the lift motor room and for stair shaft pressurisation (smoke extract). The saving in red is for drainage under the building, because we have half the number of downpipes coming down to ground level.
- Preliminaries have been increased (red), but the percentage for overheads and profit (light blue) is assumed to be unchanged.
In conclusion, the saving in capital cost, adding 5% for design and price risk and 5% for construction contingency, is approximately £118,000.
Scenario 2: Adding another floor and reducing footprint – energy costs
- The building has become more cubic and so the large saving in areas of roof and rooflights more than offset the small extra loss from the relatively small extra of vertical envelope. Infiltration air losses are reduced for the same reason.
- The slight extra on mechanical ventilation is because of venting the lift motor room.
- Air supply losses are unaffected as the occupancy is unchanged.
- There is a small extra cost for the eight-person lift, but this is assumed to be key operated and only used by disabled people and for moving goods.
- The slight increase in window area is caused a predicted reduction in usage of lighting. However, this was outweighed by the increase in gross floor area (for the stairs and lift), so there is an overall slight increase.
- In summary, the overall effect on energy consumption is a saving of £741 a year. Over a period of 30 years, using a real discount rate of 3.5%, the net present cost (NPC) is £13,630, say £13,500.
-
Scenario 2: Adding another floor and reducing footprint – repair and maintenance costs
- It would be overwhelming to show all the data, so the figures here focus on the areas where most change has occurred – the building envelope and the lift. The graph right illustrates an increase in the NPC of £5500. Not surprisingly, the dominant issue is the lift.
- The replacement costs are relatively low compared with the figures for unplanned maintenance. The reason is that the theoretic input component lives are generally a bit beyond the time horizon of 30 years, so no replacement cost are calculated when this happens. However, real world data is more fuzzy than that, so some failure, part replacement and remedial work before 30 years has been allowed for under the heading of “unplanned (or response) maintenance”.
Note to readers
Although the model used by Currie & Brown is good at calculating quantities automatically, this does not replace the need for judgment. Rates may need to be adjusted for economies of scale. Construction time and preliminaries for the form of construction also need to be examined. There will always be matters which sit outside of the model such as enabling works like diverting drains, or works in connection with phasing such as allowing for service diversions and/ or temporary services. The limitations of the model and as well as its strengths must be recognised. About the author
David Weight is a chartered surveyor working with Currie & Brown. E-mail david.weight@curriebrown.com, telephone 07764 353540, or alternatively contact Liam Kirby at Liam.Kirby@curriebrown.com, telephone 020-78348400 or 07977 574136
Acknowledgements and references
Thanks to:
- The Steel Construction Institute and Corus for their help with the structural modelling for steel frames
- Hoare Lea and Partners for checking and helping fine-tune the mechanical and electrical models and accreditation of the design load calculations.
References:
- 1 “’Patterns’ cost modelling”, �ڶ����� Cost Modelling and Computers, (E. & F.N. Spon, from 1986 International Conference on Cost Modelling, ed: Prof Peter Brandon)
- “Best Value in Construction” (Blackwell Publishing with the RICS Foundation ed: John Kelly, Roy Mortledge and Sara Wilkinson).
Downloads
Scenario 1: An increase in ceiling height and glazing – capital costs
Other, Size 0 kbScenario 1: An increase in ceiling height and glazing – repair and maintenance costs
Other, Size 0 kbScenario 2: Adding another floor and reducing footprint – capital costs
Other, Size 0 kbScenario 2: Adding another floor and reducing footprint – repair and maintenance costs
Other, Size 0 kb








No comments yet